How it works
From address to solar plan
in under 3 minutes
No forms. No quotes. No salespeople calling you. Just enter your address and our AI does everything.

Step 01
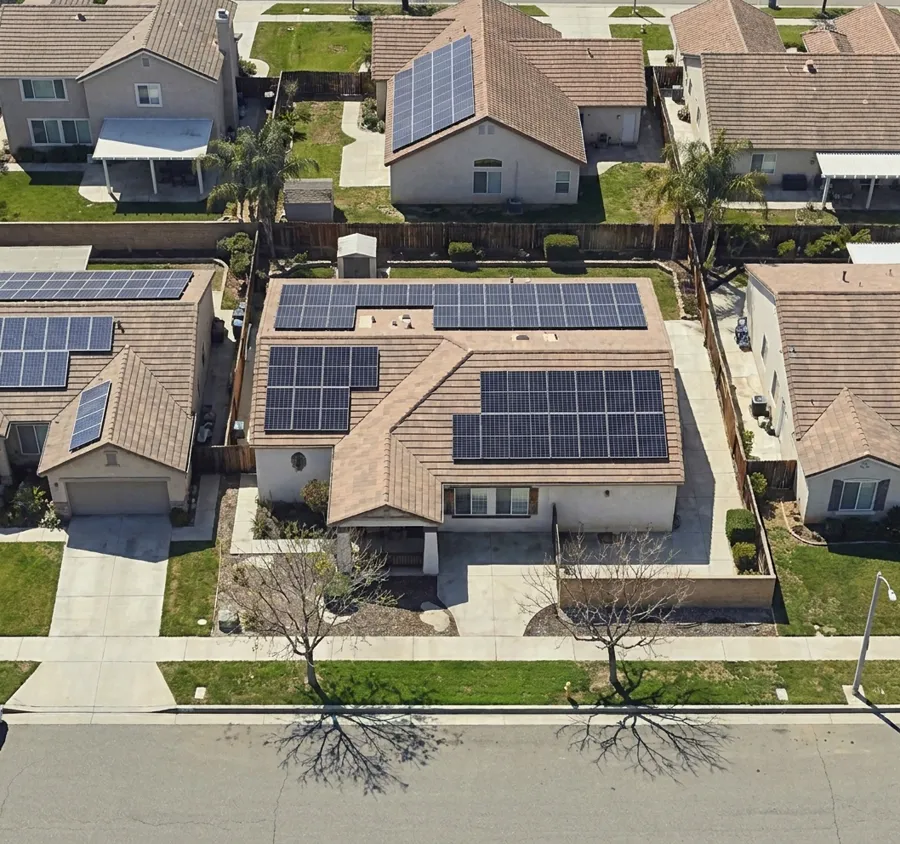
Enter Your Address
We pull high-resolution satellite imagery and your exact rooftop blueprint from our aerial data network — real 3D data from your actual roof, not generic estimates.

Step 02
AI Analyzes Your Roof
Our AI measures usable area, shading, pitch, and orientation. Our proprietary satellite AI calculates peak sun hours and the optimal panel configuration for your specific home.

Step 03
See Your Home With Solar
AI renders your home with solar panels installed — photorealistic satellite top-view and 3D drone perspective. Plus your full 25-year savings projection.

Step 04
Get Your Full Report + Postcard
Personalized savings breakdown, payback period, panel count, system cost, and net 25-year ROI — plus a physical postcard mailed to your door.